Bitcoin's Price Surge: What Lies Ahead?
Written on
Market Phases and Insights
The question of which market phase we are currently navigating has been a recurring topic in our discussions. Welcome to this edition of Surfing the Market! As we reach our 19th session, I hope these straightforward technical analyses have been helpful in providing various market viewpoints.
Let’s begin with our typical weekly outlook.
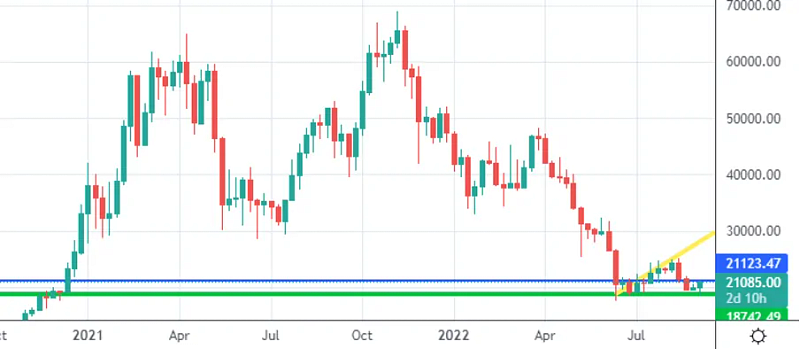
Weekly Perspective — Source: Tradingview
We’ll examine the most recent price levels, particularly focusing on the green horizontal line, which dates back to late 2020. This area, priced between $18,500 and $19,000, has historically acted as a robust resistance, providing a solid bounce in the past couple of days—allowing me to secure several profitable trades.
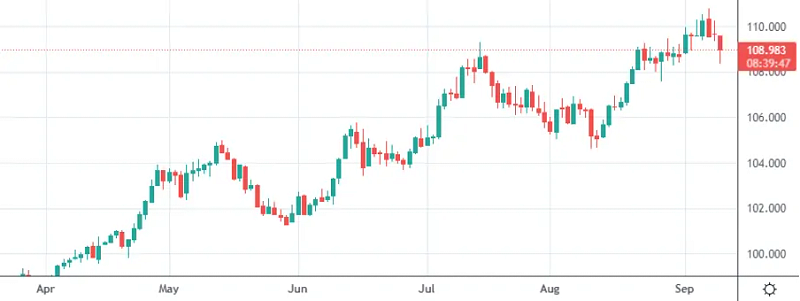
The Dollar Strength Index indicates local weakness, likely contributing to Bitcoin's recent strength. What’s your take on why I aim to accumulate more than 0.003 BTC? Share your thoughts in the comments!
Daily Price Expectations
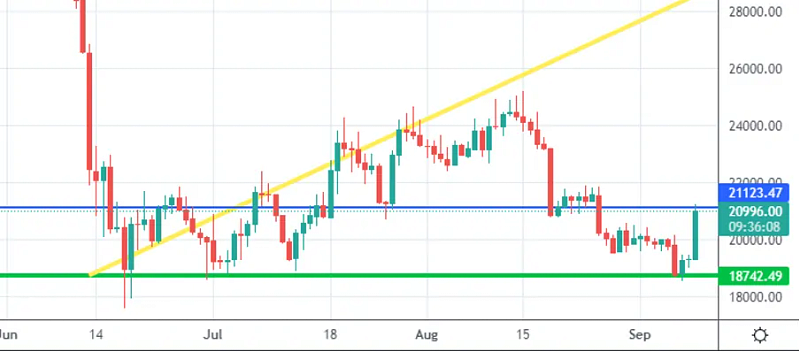
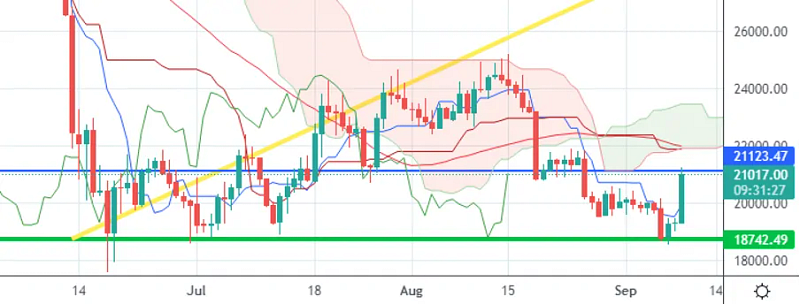
Reflecting on my previous insights, the blue line has indeed been breached in the anticipated scenario. Currently, the price seems poised for a potential bounce back towards the blue level, with $18.8k still in reach.
I foresee resistance here, with a possible pullback towards the $20k region, setting the stage for a subsequent bullish trend.
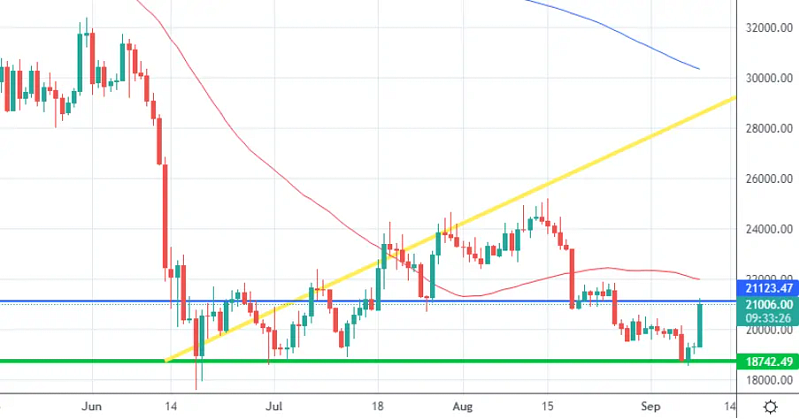
In this daily chart, we see significant levels and the Moving Averages: the red line represents the 50-period MA, while the blue line indicates the 200-period MA. The 50 MA continues to exhibit a bearish trend, approaching the current price, which may serve as a temporary dynamic resistance.
We are nearing the lower boundary of the Ichimoku Cloud, which could either act as a resistance or propel the price upwards. Notably, the coincidence of the 50 MA and the bottom of the Ichimoku Cloud around $22,000 could pose a formidable resistance.
Profits and Market Sentiment
Here are the profits I secured last week through smaller long positions.

What should we watch closely? The market appears bullish, but as confidence builds, it can also lead to traps. Therefore, I will proceed with caution regarding new long positions, waiting for a solid breakout from the blue line before entering.
Feel free to share your opinions on this weekly update and suggest any indicators you’d like me to cover or clarify in future analyses. Stay tuned and follow for notifications on new content!
Promotional Insight
One last note: if technical analysis isn't your cup of tea or you prefer not to spend too much time on the markets, consider checking out the Zignaly platform. As an official Binance Broker Partner managing significant volumes, they offer excellent Profit Sharing Trading services, enabling you to copy professional traders and share in their profits! If you're interested in receiving updates on our partner’s indicators, let us know in the comments!

Disclaimer: The information presented here is not financial advice. Conduct your own research before making any investment decisions.
When will Bitcoin Go UP again? - This video explores the factors that could influence Bitcoin's price movements in the near future.
Bitcoin Is Halving | What You MUST Know - A deep dive into the implications of Bitcoin's halving event and what it means for traders and investors alike.