Mastering Network Troubleshooting for Kubernetes Workloads
Written on
Chapter 1: Introduction to Network Troubleshooting
In the realm of cloud-native applications on Kubernetes, one frequently encountered task is the examination of network communications. This often involves assessing incoming traffic to analyze requests and responses. Many of you may find this scenario quite familiar.
To tackle this challenge, I typically rely on tcpdump within the container, akin to practices in traditional environments. However, this approach isn't always straightforward. Depending on the specific configuration and environment, one might need to integrate a new package into the container image, necessitating a fresh deployment.
To alleviate this hassle, I came across a tool called Mizu. I wish I had discovered it earlier, as it would have significantly simplified my work. Mizu describes itself as follows:
Mizu is an effective API traffic viewer for Kubernetes, designed to provide insights into API interactions among microservices across various protocols, assisting in debugging and troubleshooting regressions.

Chapter 2: Getting Started with Mizu
Installing Mizu is a straightforward process. You'll need to download the binary and set the appropriate permissions on your device. Different binaries are available for various architectures. For my Intel-based Mac, I executed the following commands:
Once this is complete, you will have a binary on your machine that connects to your Kubernetes cluster via the Kubernetes API. Ensure that your context is properly configured.
For demonstration, I deployed a simple nginx server using the command:
kubectl run simple-app --image=nginx --port 80
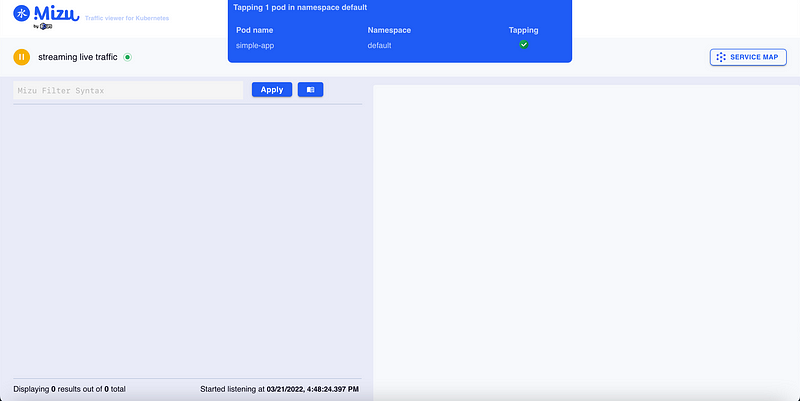
After deploying the component, as illustrated in the Lens screenshot below, I initiated Mizu from my laptop:
mizu tap
In a few moments, a webpage opened, displaying real-time traffic monitoring for the pod.

Chapter 3: Sending Requests and Analyzing Traffic
Next, I exposed the nginx port using the command:
kubectl expose pod/simple-app
Then, I deployed a temporary pod with the curl image to send requests:
kubectl run -it --rm --image=curlimages/curl curly -- sh
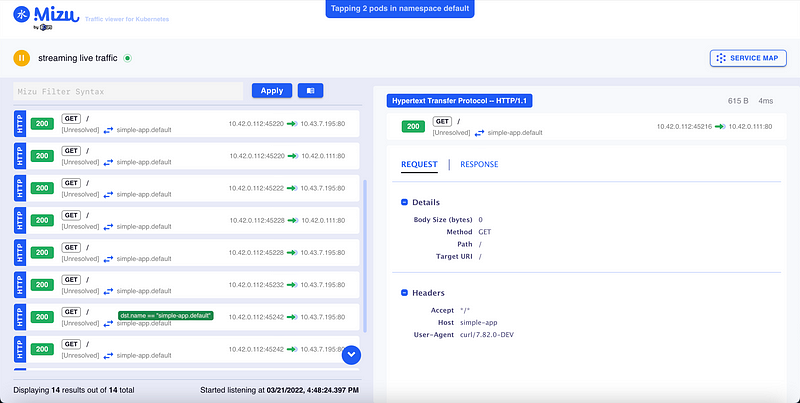
Using curl, I began to send requests to my nginx pod:
curl -vvv http://simple-app:80
After a series of requests, I was greeted with a wealth of information, including detailed request data.

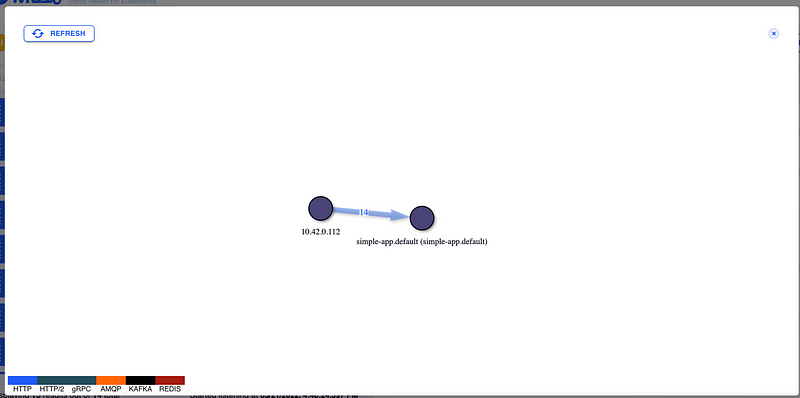
More importantly, I could visualize a service map diagram illustrating dependencies and the call flow to the pod, complete with response times and protocol usage.

While Mizu is not intended to replace comprehensive observability solutions atop a service mesh, it serves as a valuable tool for debugging specific communications between components. Essentially, it acts like a high-level tcpdump for pod interactions.
Chapter 4: Video Resources for Enhanced Learning
To deepen your understanding of troubleshooting Kubernetes networking, consider these helpful video resources:
Discover strategies for effectively troubleshooting Kubernetes networking issues with insights from Thomas Graf.
Learn how to understand and resolve connectivity challenges in Kubernetes with practical advice and demonstrations.