Constructing the Riemann Integral: A Deep Dive into Real Analysis
Written on
Chapter 1: Introduction to the Riemann Integral
This series focuses on the development of the Riemann integral, exploring its connections to derivatives and its significant applications. In high school calculus, students often encounter graphs of arbitrary functions f(x) over an interval [a, b], which provide a visual representation for calculating the area beneath the curve y = f(x).
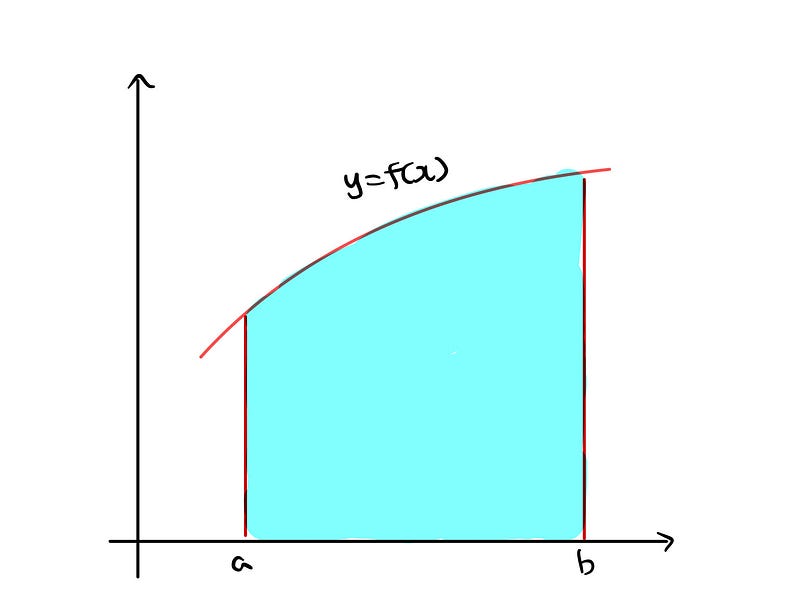
The geometric illustration above should be quite familiar. As taught in school, a straightforward method involves dividing the interval [a, b] into equal segments and placing a rectangle under the curve that merely touches it.
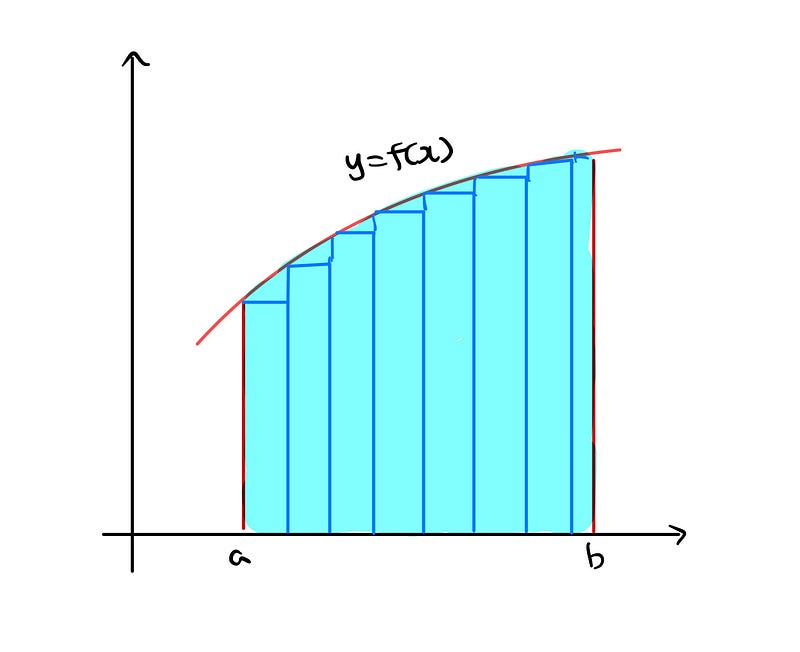
The total area of these rectangles is computed, and with an increasing number of segments, the total area should converge to the desired area beneath the curve. This concept is fundamentally rooted in Newton's approach. However, there are notable challenges with this method. Firstly, it isn't immediately clear that the total areas of the rectangles converge to a limit as the intervals increase. Secondly, it is possible to identify pairs of functions f and g that demonstrate...

Can you think of any such functions f and g?
To circumvent these issues, we will adopt a more flexible approach.
Section 1.1: Understanding Partitions
Let’s consider a partition P of the interval [a, b], which consists of a finite sequence of numbers.

The endpoints, a and b, are the starting and ending points.
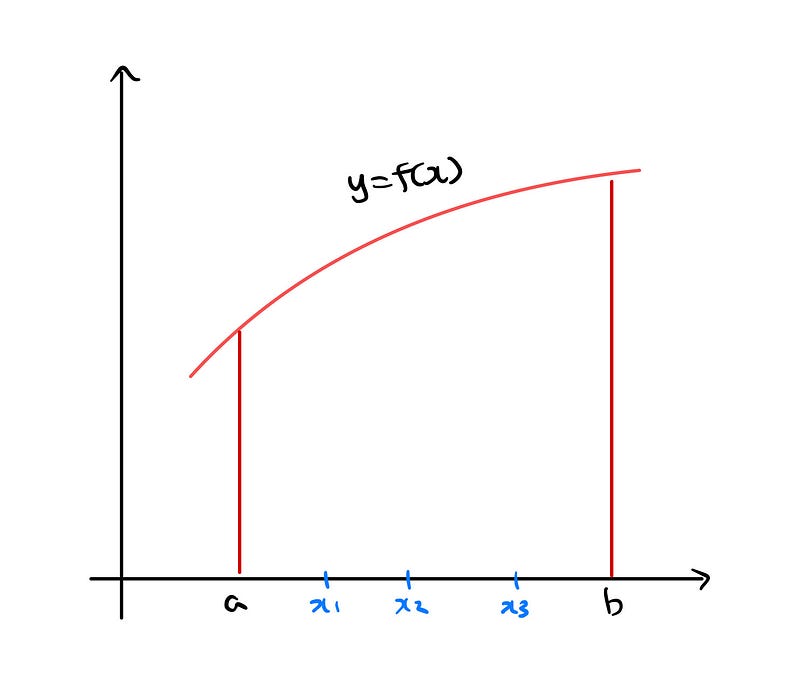
As illustrated, these points divide the interval into n segments. For instance, if n = 4.
Now, assume that f : [a, b] → R is a bounded function. For each segment i, we define mi and Mi as follows:

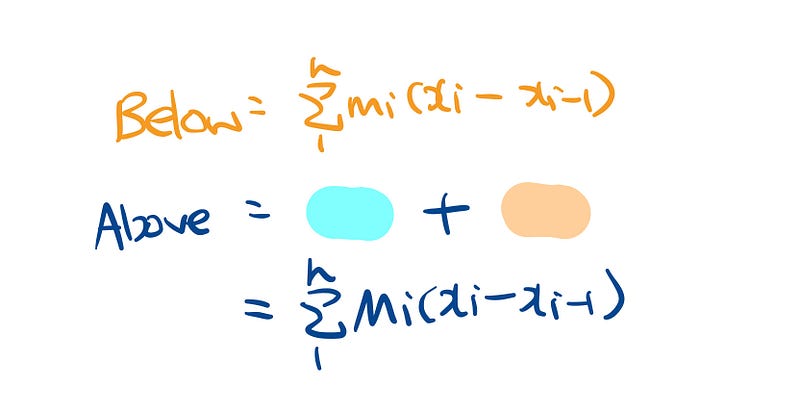
Here, mi represents the ‘infimum’—the lowest value that f attains on the ith segment—while Mi signifies the ‘supremum’—the highest value on the same segment.
To visualize this, let’s examine the following diagram.
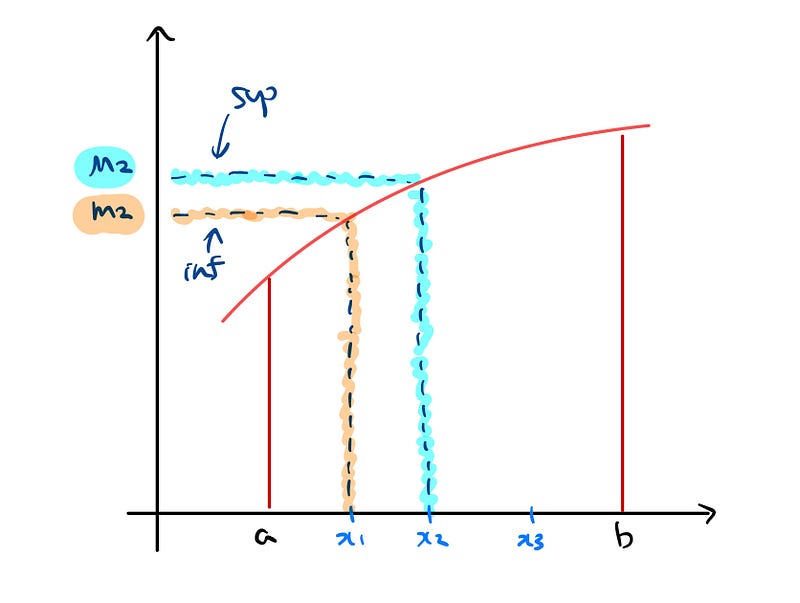
The orange section indicates the infimum, while the blue section represents the supremum. This illustrates the height of a rectangle below the curve according to the interval, and the height of one above it.
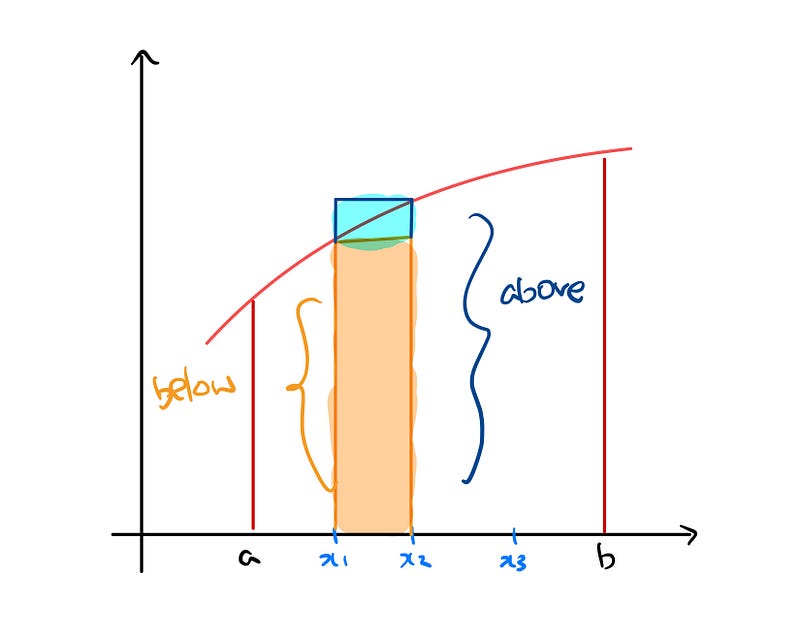
The total area of the rectangles below the curve consists of all the orange rectangles spanning from a to b. Conversely, the total area above the curve includes both the orange and blue rectangles across the same interval.
This serves as a good stopping point. In the next section, we will delve into the definitions of upper and lower sums, along with related problems.
Chapter 2: Further Exploration of Riemann Integrability
This video provides a complete formal construction of the Riemann integral, offering insights into its theoretical underpinnings.
In this video, the concept of Riemann integrability is explored in the context of real analysis, further elucidating the integral's significance.
Thank you for reading! If you found this article valuable, please consider showing your support.